ABACUS REPORTING
MEASURE - MONITOR - MANAGE
Abacus displays accurate, historical and live people counting data in a format for you to easily interpret and understand.
 Abacus reporting allows you to choose from a range of graph styles to present your footfall counts and analytic data in a meaningful format. You can build up comparative reports by overlaying multiple data sets in different graph styles on the same page. Abacus delivers live near real time dashboard visualisation, providing live performance information for operational staff.
Abacus uses advanced, searching algorithms to easily search for the data you need from the database. It allows you to drill down to specific sites, time periods or events and delivers the data quickly and efficiently.
Customize
Use a variety of filters to deliver bespoke, custom data from a plethora of sources. Use this to fetch data from different locations, and compare statistics based on different parameters to understand how different sites are performing. Create and save searches and reports for future use.
Time Range
Abacus can further filter data based on the time you want to see data from. View data on hourly, daily, weekly, monthly or even yearly figures.
Dynamic time ranges can be created to further enhance the comparison of your data. Compare statistics from the previous week or month, to help create predictions for the future.
Charts & Graphs
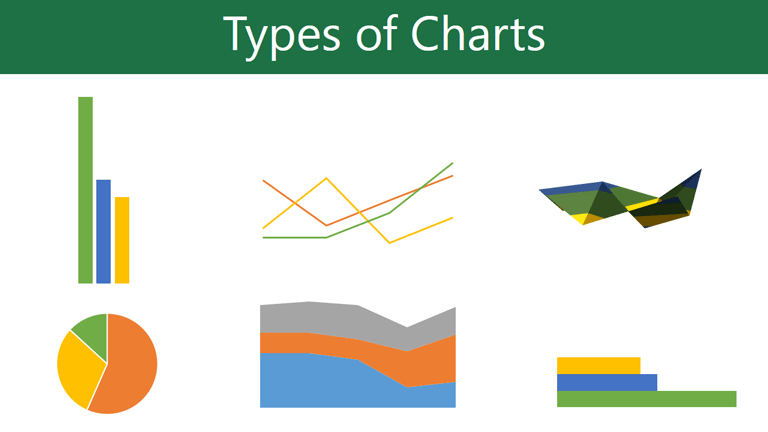 Display the footfall data in a format you deem appropriate
- Line and spline graphs can be used to compare multiple statistical series
- Area charts can be used to show trends over time
- Bar graphs can be used to compare different groups of data
- Pie charts can be used to compare percentage data
- Matrices are used to show raw data in a table format.
Multiple data from different sources can be displayed in different formats on the same axis and table providing multi layered graphical representation of your analytic data.
Event Types
Where you use advanced video analytics you can search by a variety of event rules, or types. Find figures such as in/out count, dwell times, queue times, object size, speed, enter/exit count, object appearances/disappearances etc.
Programmable Views
Program your own filters to lay on top of the reports. Have your own set of custom reports ready for your viewing every time you log in.
Data Export
Export the report data to shared drives, and save information in a variety of formats. When a report is created, you can save it to a shared drive or send it to other users, email it, print it, PDF it, or create a CSV file for use within Excel, or to import into another business management system
